What 11,000+ Hotel Reviews Tell Us: The SENTEEZ Study Breakdown
A plain-English walk through the SENTEEZ public-data study of 11,127 reviews across eight luxury hotels in Dubai Marina: what guests talk about, how sentiment shifts from one department to the next, and what each person on a hotel team can do with it.
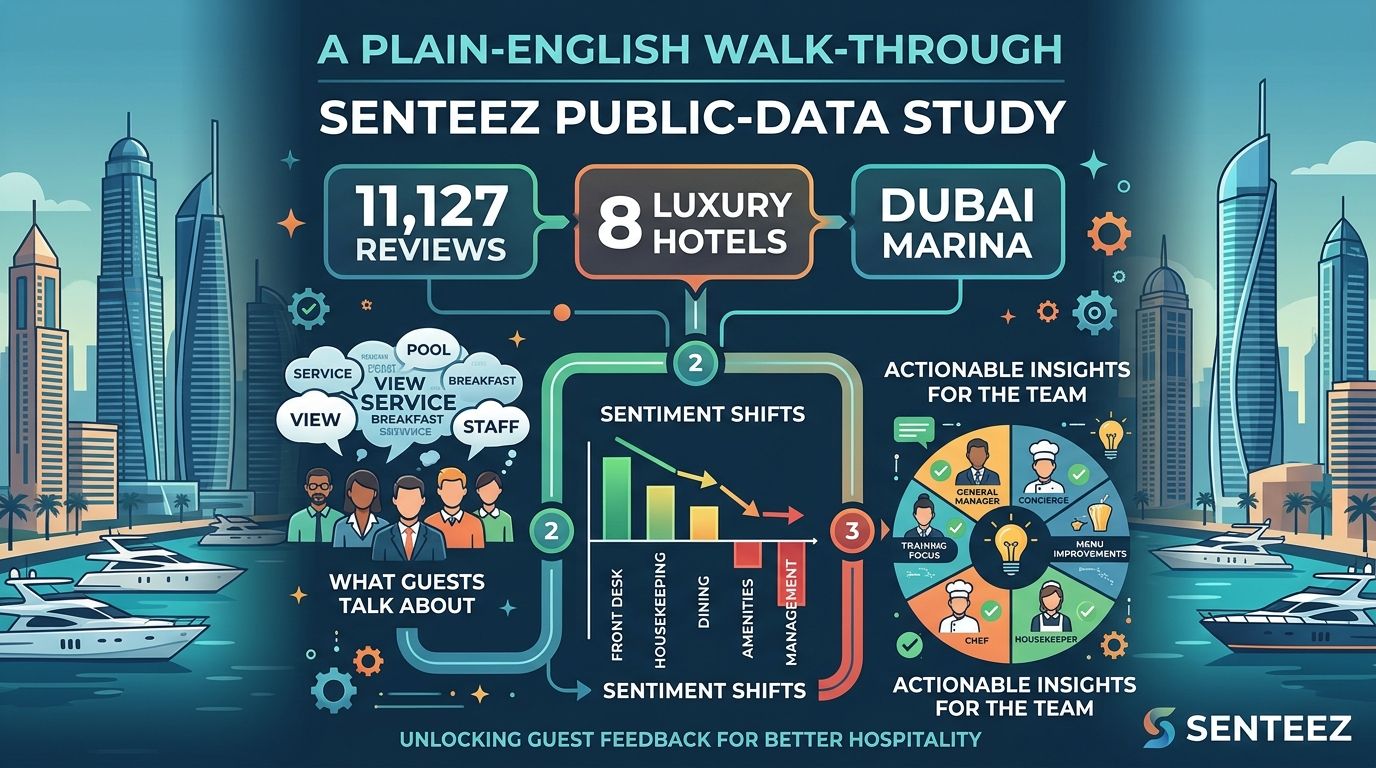
Across 11,127 reviews and 13 themes, not one theme scored below 86% positive. Yet guests still left 6,828 negative mentions, and the biggest pile did not sit where the lowest score was.
That’s the trouble with star ratings. A hotel can look perfectly healthy at 90% positive and still be hiding a thousand complaints about a single department.
At DGTAL & Web Solutions, we built SENTEEZ to read reviews by department rather than by stars. To put it to the test, we analyzed a public-data sample of 11,127 reviews across eight Dubai Marina hotels. Here’s what we found, and where the data stops being reliable.
About the study
The dataset
The sample covers 11,127 public guest reviews of eight luxury hotels in Dubai Marina, UAE, collected over the period. We used public reviews only, and none of the hotels took part.
The method
We used aspect-based sentiment analysis. Rather than giving each review one overall score, it scores every theme a guest brings up separately, based on the review text and not just the star rating. So a review that loves the room but grumbles about breakfast gives us two signals, not one.
Review Mentions vs unique reviews. A single review can touch on several themes, so we count in mentions. Across the 13 themes, the totals add up to about 70,800 Review Mentions from 11,127 reviews, or roughly 6.4 mentions per review. Unless we say otherwise, every share and count below is a Review Mention count.
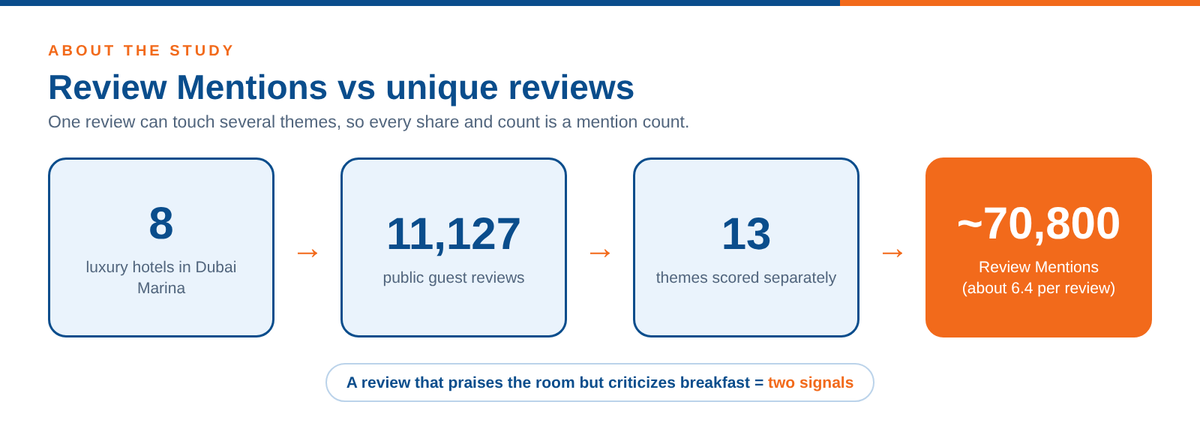
Headline findings at a glance
FINDINGS AT A GLANCE
- Most discussed: Services & Staff, Room Quality and Cleanliness & Hygiene make up about 41% of all Review Mentions.
- Narrow range: theme sentiment runs from 95% positive (Ambience) down to 86% (Wait Time). Price, the closest theme to value for money, lands mid-pack at 89%.
- Rate is not volume: Wait Time scores lowest but holds only about 7% of negative mentions. Services & Staff and Room Quality together hold about 31%.
- Same marina, different results: the top-rated third of hotels beats the bottom-rated third by [XX] points on [aspect].
- Recurring themes: noise, air conditioning, breakfast and queues keep showing up behind the lower scores.
Finding 1: What guests talk about most
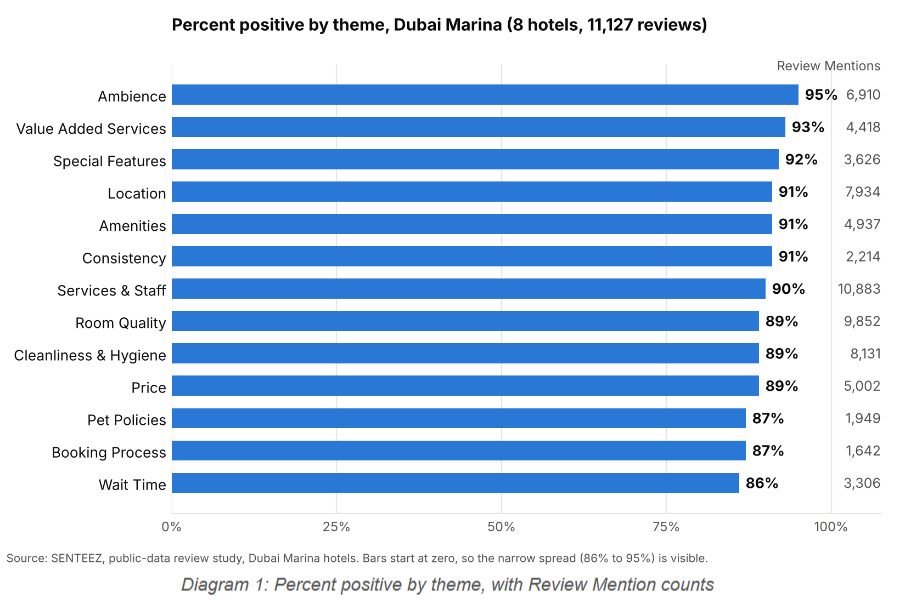
Guests don’t spread their attention evenly. Services & Staff leads with 10,883 mentions, about 15% of the total. Room Quality comes next with 9,852 (about 14%), then Cleanliness & Hygiene with 8,131 (about 11%). Add Location at 7,934 and those four themes cover roughly half of everything guests said. At the other end, Booking Process (1,642) and Pet Policies (1,949) each draw under 3%.
Keep in mind that volume shows what guests care about, not whether they’re happy. (Shares are calculated from the published theme totals.)
Finding 2: Where sentiment is strongest and weakest
Ambience is the strongest theme at 95% positive, followed by Value Added Services (93%) and Special Features (92%). The weakest is Wait Time at 86%, with Pet Policies and Booking Process at 87%.
Many people assume value for money is the usual weak spot. In this sample, it isn’t: Price scores 89% positive (4,473 of 5,002 mentions). The complaints that do exist are specific: rates that feel high for the room, dated rooms, and billing problems like double charging and delayed refunds.
Volume changes the picture, though. Services & Staff is 90% positive yet carries the most negative mentions (1,064, about 16% of all negatives). Wait Time scores lowest at 86%, but carries just 479 (about 7%).
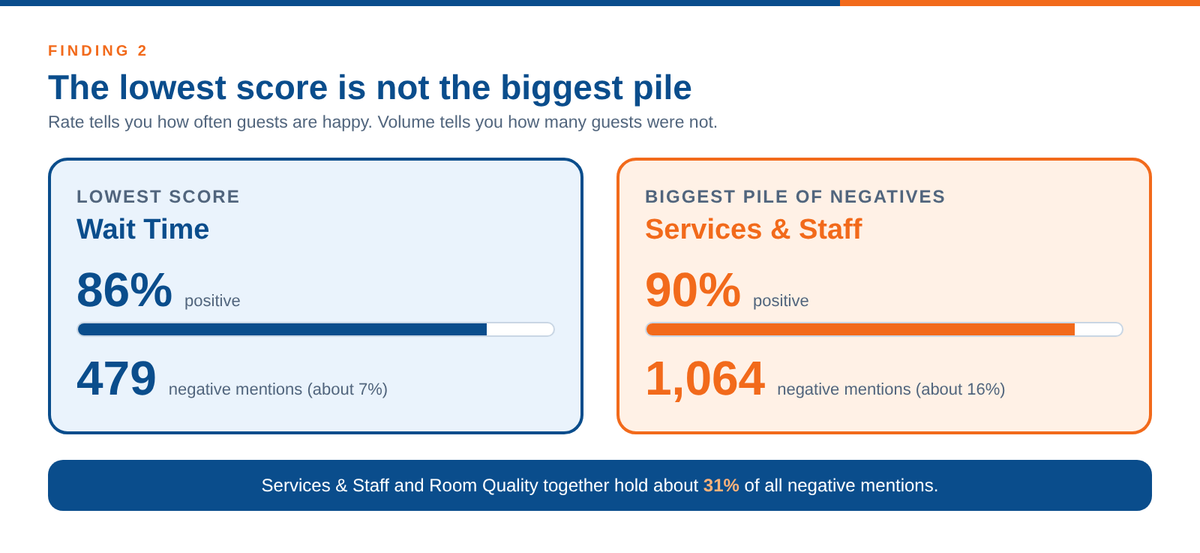
A lower score and a bigger pile of complaints are not always the same theme
Finding 3: Where hotels in the same town differ most
All eight hotels share the same marina and the same climate, so the gaps between them are the closest thing public reviews offer to a view of what management controls. We compared the top-rated third of hotels with the bottom-rated third, roughly three hotels at each end.
Finding 4: Themes behind the scores
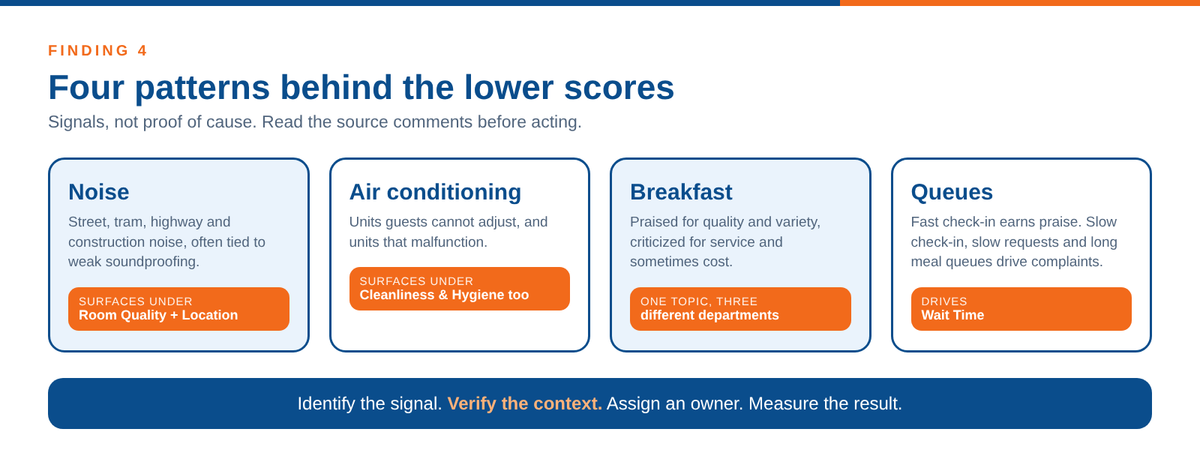
Scores tell you where a problem sits. Comments tell you what guests are describing once you get there. Four patterns come up again and again in the lower-scoring comments:
- Noise: street, tram, highway and construction noise, often linked to weak soundproofing. It shows up under both Room Quality and Location.
- Air conditioning: guests mention units they can’t adjust and units that break down. The breakdown comments land under Cleanliness & Hygiene, not Room Quality, which is exactly why theme scores alone can hide them.
- Breakfast: praised for its quality and variety, but criticized for service and, in some comments, seen as pricey. One topic, three different departments.
- Queues: fast check-in and check-out earn praise, while slow check-in, slow responses to requests and long meal queues drive the Wait Time complaints.
We treat these as signals, not proof of cause. A cluster of air-conditioning comments tells a general manager where to inspect first, not why a score dropped. That’s why SENTEEZ keeps the source comments in view: teams should read what guests actually wrote before they act.
What each reader should take from it
The same data answers different questions depending on your role.
- Owner: Compare your properties on identical themes, and ask why the gap between your best and worst one exists.
- General manager: Start with the theme that pairs high volume with a below-average score. Here, that’s Room Quality (9,852 mentions, 89%) and Cleanliness & Hygiene (8,131, 89%).
- Department head: Read the source comments behind your own theme. Noise and air conditioning belong to rooms and engineering, breakfast to F&B, and queues to the front desk.
- Revenue manager: Read the Price comments for what they actually describe. Rates that feel high for the room and billing errors need very different fixes.
Whatever your role, the loop is the same: spot the strongest signal, check the context, give it an owner, and measure the result.
Limits of public review data
Public reviews tell you what guests say, not what really happens inside the hotel. Reviewers choose themselves, and people with strong experiences are more likely to write. This study covers eight luxury hotels in one neighborhood, so it isn’t a picture of hotels everywhere, and with only eight hotels, a single outlier can move a “third”.
Themes with thin mention counts belong on a watch list rather than driving decisions. In this sample, Booking Process and Pet Policies are the thinnest, so their 87% scores are less stable than the 90% on Services & Staff. Automated sentiment supports human judgment. It doesn’t replace it.
See your own hotel in this data
Curious how your property reads by department?
Request your free teaser report at SENTEEZ →
You’ll see your strongest signal, your weakest, and how you compare with competitors on identical themes.
Frequently Asked Questions
How was the study built?
With aspect-based sentiment analysis of 11,127 public reviews of eight Dubai Marina hotels. See “About the study” above and the SENTEEZ methodology page.
Are the hotels clients?
No. SENTEEZ describes its sample analyses as independent and built on publicly available reviews, not on client engagements.
Can I see my hotel’s numbers?
Yes. The free teaser report is built from your public reviews, with no integration and no login. Request it at senteez.com/request-teaser.
How often is the data refreshed?
SENTEEZ hotel scores use a rolling 12-month window and refresh quarterly. This study is a snapshot of the sample as published in August 2026.